 I’m currently working on monthly reports for our ongoing AdWords clients. As part of the reporting process I regularly use the “compare to” feature in Google Analytics to see how ad campaigns are performing compared to last month and the same month last year.
This article explains how to use the “compare to” feature and why it provides valuable information.
Once you’ve had Google Analytics and Conversion Tracking set up and working for over a year you can use the ‘compare to past’ feature to see how your website performance stats compare to the same month the previous year.
This is particularly valuable if your web traffic is impacted by seasonal trends, Christmas, school holidays, economic factors and other external factors. It allows you to see at glance if your web traffic has increased year on year for each traffic source, which gives you insights into whether or not your marketing resources and budget are paying off.
You can use the same feature to compare web traffic and conversions month on month, or to any other time period that you want to look at. Always take into account the external factors that could be having an impact on your online results, and if you changed your marketing strategy during the time period that you’re reviewing.
Side note – If you do make changes to your website or marketing strategy, use Google Analytics Annotations to note the date that the changes were made. Read more about annotations.
Here are the steps to use the ‘compare to past’ feature
1.Log into Google Analytics via google.com/analytics
2.The date range is shown in the top right hand corner of all screens within Google Analytics.
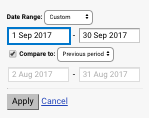
Select the date range that you want to view. For example in the screen shot below I’ve selected 1 to 30 September 2017 using the drop down arrow.

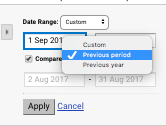
3.Click the check box to the left of ‘compare to’

4.Select the period that you want to compare, either previous period (the same number of days prior to the number of days in the date range you selected), previous year (the same date range for the previous year) or custom (compare to a date range that you select).

5.Click apply
View your reports
You’ll now see two sets of data. One for the selected date range and one for the ‘compare’ date range.
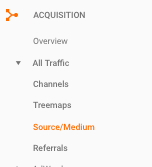
I find this particularly useful when comparing traffic source/medium and conversion data. You can see this by selecting Acquisition in the left hand column, then All Traffic and Source Medium.

Then you can review how your sessions, new users, bounce rate, pages per session and avg session duration compare from one period to another.
And if you have conversion tracking set up you can also compare the number of conversions and conversion rate. eCommerce websites with eCommerce tracking set up can also compare eCommerce revenue between time periods.
Read more about the different types of conversion tracking you can set up.
Happy comparing!
If you’re one of our AdWords clients, we use this feature regularly in monitoring your campaign performance, as well as comparing the stats that are available within your AdWords account.
Until next time
Mel
About Melinda
Melinda aka Mel is a Google Partner, Google Ads & Consultant, Speaker and Trainer and co-owner of Click-Winning Content.
Mel provides results-driven services to organisations around the world and is committed to never using an acronym without explaining it first. She also likes greyhounds as pets, grand slam tennis, cracked pepper and Melbourne sunsets.
Please connect at the links below.
