 Google Analytics can provide a lot (and I mean, A LOT!) of information about how your website is performing and how well it’s helping to achieve your business goals. It’s great to access to all this data when you know what it means, but when you’re getting started it can be overwhelming.
To make it easy for you to know where to start in terms of understanding your Google Analytics data, I’ve explained some of the key statistics below.
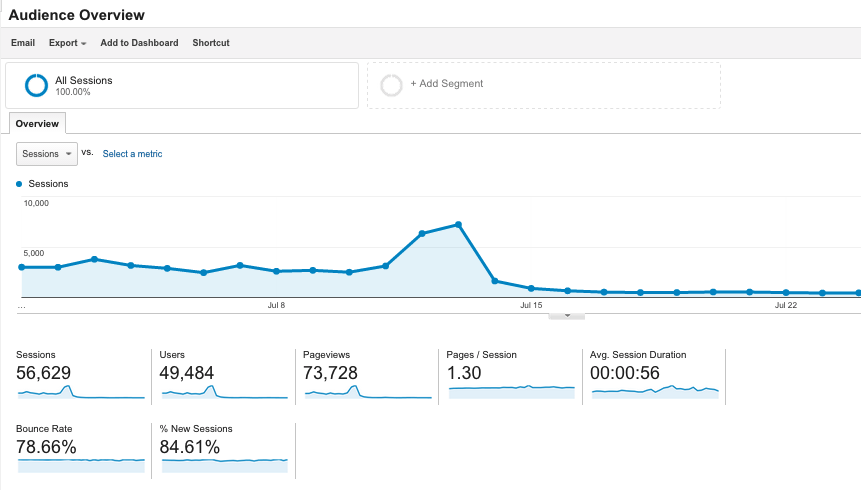
The stats described are seen on the Audience Overview dashboard, which is the first screen you’ll see when you view your Google Analytics data, and also throughout the other reports.
Users
Users is the number of individuals you have visited your website.
Note – If the same person visits from different devices they are tracked multiple times, unless you’ve customised Universal Analytics.
Sessions
This is the total number of sessions created by people who have visited your website. This includes people who visit more than once. If you are running marketing campaigns with the aim of increasing your web traffic and getting people to visit your website regularly, then your Sessions should increase. Blogging is a great strategy to achieve an increase in both Users and Sessions.
Bounce Rate
Bounce Rate is the percentage of people who leave your website without visiting more than one page. Another way to explain it is that it’s the percentage of people who view one page of your website, and then don’t click a link through to viewing a second page.
For bounce rates, the lower the better.
Bounce Rate is a key measure of how engaged people are with your web content ie are they engaged enough to at least click something to view more than one page. Note though, if you have a blog, often your regular readers will visit your website, spend time reading your article, and then “bounce away” so this will make your bounce rate higher.
Average Session Duration
The is the average time that your visitors spend reading your website (this gives an indication of the quality of your content and ease of navigation).
Pages Per Session
This stat is exactly what it says, the average number of pages viewed on your website during a visitor session.
This article has explained the key stats to understand about your website audience. Get familiar with these stats for your website, so that you’ll quickly be able to identify if they changes for the better, or the worse.
Access our FREE Google Analytics 101 videos and you’ll also be notified via our eNewsletter when new articles are available.
Access the “CWC Dashboard – Get Started with Google Analytics”
To make it even easier for you to get familiar with the key information from your Google Analytics account, I’ve created what’s called a Custom Dashboard.
You can import my Custom Dashboard in to your Private Google Analytics dashboards, and by clicking on it you’ll see key information at a glance.
Hope I didn’t lose you in the terminology above!
Just follow the steps below. Can’t promise it will be a barrel of laughs but I promise it’s easy.
1. Click this link to the CWC Dashboard – Get Started with Google Analytics template
2. Sign in to the Google account that you use to access Google Analytics
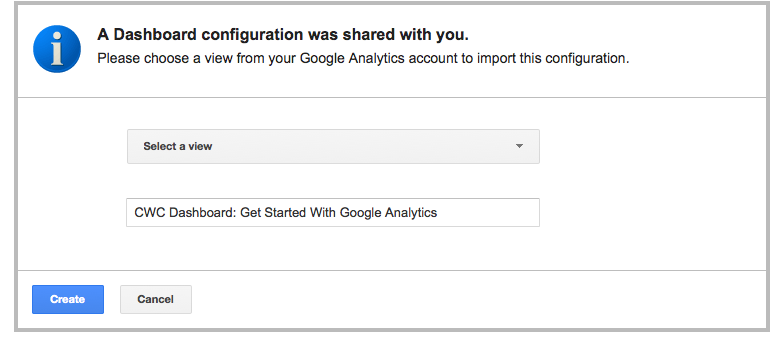
3. You’ll see something like the screen shot below
4. Select the View to add the Dashboard too (you’ll probably one have one) and then click “Create”
5. You’ll then see the Dashboard with your data included
6. Adjust the date range in the top right hand corner for the date range you’d like to view, and use “compare to past” if you’d like to compare the stats for the previous period, specific dates or year.
7. To view the Dashboard anytime when you’re logged in to Google Analytics, select Dashboards at the top of the left hand navigation and then “Private” and you should see the link to “CWC Dashboard – Get Started with Google Analytics”.
Need professional help with Google Analytics?
We offer custom services in 1-to-1 Google Analytics training, creating Custom Dashboards to suit your needs and Setting up Google Analytics Goals.
Google Analytics Goals are the gold in terms of identifying whether or not your website is effectively helping you achieve your business goals.
Enquire about our rate for Google Analytics 1-to-1 training and small group workshops.
Note: This package includes setting up Destination, Pages/Session and Time on Site Goals. Destination Goals are dependent upon how your website is set up. Additional help may be needed from your web developer to set up Destination Goals and if Event Tracking and eCommerce Tracking is required.
About Melinda
Melinda aka Mel is a Google Partner, Google Ads & Consultant, Speaker and Trainer and co-owner of Click-Winning Content.
Mel provides results-driven services to organisations around the world and is committed to never using an acronym without explaining it first. She also likes greyhounds as pets, grand slam tennis, cracked pepper and Melbourne sunsets.
Please connect at the links below.


